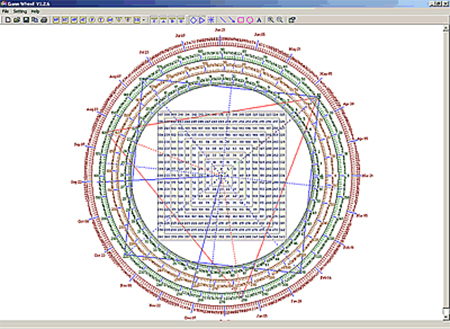
Gann Wheel 1.2
Gann Wheel is the implemention of W.D Gann's Marster Chart. An power tool to help traders to find price support and resistance.Overview
Gann wheel software is a must have item for stock market and futures market traders. Whether trading stocks or commodities, day trading, swing trading or position trading, using technical analysis or fundamental analysis, THE GANN WHEEL will transform your trading from speculation to professional and profitable investing. THE BEST KEPT SECRET ON WALL STREET. Gann Wheel is the implementation of W.D Gann's marster chart. It includes Square of Nine, Circle of 24 and Hexagon Chat. It's a powerful tool designed to help traders to find price supports and resistances.Gann Wheel 1.2 is fully functional. It's free to use for 30 days. To continue using Gann Wheel beyond their respective evaluation periods, you must purchase a license, is $59.00 USD.
The Square of 9 is probably W.D. Gann’s most famous Master Chart. Many traders use this chart regularly as a primary trading tool. However, it is my personal belief that most traders are only using a few simple techniques and are not fully utilizing the true potential of this multidimensional Master Calculator.
Gann wheel Usage
- This software enables beginners to see Gann Squares, Gann Wheels and angles it makes on the chart.- It offers a good period of trial version which should enable beginner to understand the nuances of Gann techniques.
- It is a very good tool provided you know how to use it, which believe me, is the toughest thing to do. And no two individual on this planet uses it alike!
- If you learn how to use Square of Nine, for instance, this is the Only Gann-related software you would ever require.
Square of 9
The Square of 9 is basically a spiral of numbers starting with the number one in the center (or apex of the Great Pyramid) with the number 2 immediately to the left. The rest of the numbers spiral around the center in a clockwise fashion to the number 9, which completes the first cycle of numbers around the center. 10 through 25 completes the 2nd cycle, 26 through 49 completes the 3rd , etc… This particular arrangement of numbers creates a very unique square root relationship with other numbers on the chart. Michael S. Jenkins illustrates some interesting square root trading techniques utilizing the Square of 9 in his Gann Course and his book Chart Reading for Professional Traders. Basically, if you want to move around the coordinates on the Gann Wheel you take the number you are interested in ( such as the all time High or Low price) take the square root of the number, then add or subtract 2 from the root and resquare the result. Example: Lets say that we are interested in the price 664 (which is in the vertical column straight up from the center). The square root is 25.768 + 2 = 27.768^2 = 771 which is the number directly above 664 or one full 360 degree cycle out from center.Main Features:
The Square of Nine (Price & Time)
The Square of Four (Price & Time)
The Hexagon Chart (Price & Time)
The Circle of 24
The Single and double Triangles
Spinable Overlay
Calendar Mark
Degree Mark
Day Mark
User Defined Mark
All Marks can move in circle
Adjustable Step Value
Super Large Chart Size (2000x2000)
Gann Wheel IOS
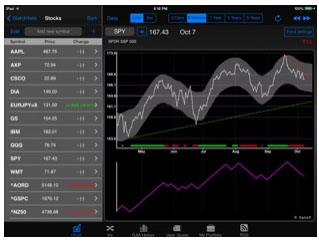
Requires iOS 8.0 or later. Compatible with iPhone, iPad, and iPod touch.
Gann 9 is the only app that allows users to effortlessly apply the legendary W.D. Gann’s tools and techniques (including the Square of 9) to analyzing, charting and trading any stock, forex or index. It will allow you to predict with high accuracy and confidence future support/resistance levels and change in trend (CIT) dates. Swing Angles are empowered with the unique ability to automatically select the correct angle step (rise, rate of vibration) applicable to any instrument in any time frame and any price scale.
The app's rich functionality is further enhanced with the addition of several in-app purchases (for the full list check Top In-App Purchases on the left).
Built-in features Include:
- Trade signals and scanner
- Tunnel indicator
- Gann retracement and range squaring tool
- Trend indicator and Trend matrix
- Swing indicator and Swing matrix
- Automatically drawn Swing Angles
- Swing exhaustion timer
- Trend Bars™ (in-app purchase)
- 130 years of DJIA price data (in-app purchase)
- Gann price and time calculator allowing user inputs
- Automatic range retracement and extension analysis
- Track stock value and % change
- Gann angles
- Gann cycles
- Square of 9
- Gann Seasonal Dates
- My Portfolio
- Extensive User Guide
- Trading Strategies section
- Real time market data and breadth indicators.
- Multiple Watchlists synced between apps
- Apple Watch scanning functionality
Cyclical Square of 9
Squares, circles, and triangles are the three most common geometric shapes that form the basis for most of Gann's work.
Gann's wheels and squares are some of the most common applications and form the cornerstone of Gann's work.
For example, Square of nine, Square of 144 and the Hexagon are some of the many works from Gann that are popular.
The square of 9 is a spiral of numbers with an initial value "1" starting at the center. Starting from this value, the number increases as we move in a spiral form and clockwise direction. According to experts, each cell in Gann’s square of nine represents a point of vibration.
The Gann Square includes two sets of numbers. The first set is also called a wheel. In it, numbers are arranged in a spiral form, with their values increasing clockwise. Each number stands for an angle relative to the center. In the second set, numbers are arranged on a plane. The classical Square of 9 comes in two types:
Diagonal;
Cyclical.
Number increase as we move from the center in a clockwise direction. To make a full rotation, we need to make a 360-degree circle moving from one cell to another (e.g., from 26 to 49, from 82 to 121, etc.).
Squares of odd numbers can be found in the lower left corner of each rotation circle (3×3=9, 5×5=25, 7×7=49, 9×9=81, 11×11=121, 13×13=169, etc.). This is why the Gann Square is called Square of 9: if you make a full rotation, you’ll get 9 (three squared).
The squares of even numbers are found above the right upper diagonal at 315° (2×2=4, 4×4=16, 6×6=36, 8×8=64, 10×10=100, 12×12=144, etc.). If you see a high/low in one of these cells, there is a high chance that the same formation (or its mirror reflection) will repeat in one rotation. This rule also applies to squares of odd numbers.
Now let’s examine the upper left and lower right diagonal lines. These lines represent a half of a rotation circle, when we move from squares of odd numbers to squares of even numbers (upper left diagonal) and from squares of even numbers to squares of odd numbers (lower right diagonal). Sounds too confusing? Let’s break it down by taking an example. We move from the square of an even number to the square of an odd number, e.g. from 16 to 25. We make the calculations: (16+25)/2=20.5. The problem with fractional numbers is that there is a high chance of an error. It all depends on your accuracy and concentration. Now we move from the square of an odd number to the square of an even number, e.g. from 121 to 144. Again, we make the calculations: (121+144)/2=132.5. As you’ve probably noticed, our calculated numbers can be found near the diagonal lines at 225°, 315°, 45° and 135°.
Now let’s move from the square of an even number to the square of an odd number, e.g. from 64 to 81. We’ll make 3 stops on our way: ¼ of a circle – 64+(81-44)/4=68.25; ½ of a circle – 72; ¾ of a circle – 64+(81-64)/4×3=76.75. If we make a full rotation, we land on 81.
Keep in mind that fractional numbers may land not only in the center of a cell but also between cells.
Diagonal cross consists of the squares of odd numbers and cells that are close to the squares of even numbers. Cardinal cross includes numbers that are close to ¼ and ¾ of a rotation circle. If you put the initial value (price high/low) into the center of the square, you’ll be able to predict significant market events long before they actually occur. This price prediction method fits both long-term and short-term trading. At the same time, it’s important to remember that using fundamental analysis is always a better idea than using technical tools, however accurate they were.
How to Calculate the Square of Nine
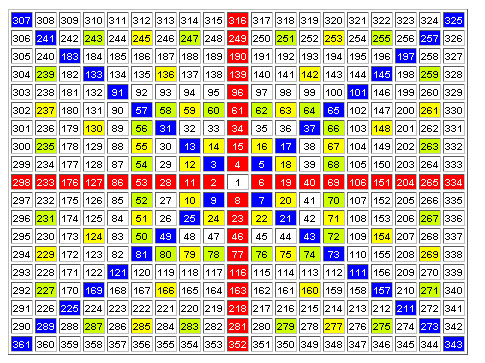
The numbers within the Gann square also follow a certain harmonic pattern. For example, when you take a number, such as 54 from the above square, the value to the next of it (to the right), 29, is derived as follows:
The square root of the number and subtract 2, and re-square the result.
Ex: 54 is the original number
The square root of 54 = 7.348469
7.348469-2 = 5.438469
(5.438469)2 = 29 rounded off
To determine the value to the left, instead of subtracting 2, the number is added. So, we simply add +2 to the square root of 54 (7.348469), bringing the value to 9.348469. We then square this result to get a value of 87.
How does the Gann Square work?
The Gann square of nine helps to identify time and price alignments in order to forecast prices.
In the Gann Square of nine, the key numbers of importance are as follows:
0 or 360 degrees: 2, 11, 28, 53…. 45 degrees: 3, 13, 31, 57, 91… 90 degrees: 4, 15, 34, 61, 96… 180 degrees: 6, 19, 40, 69…
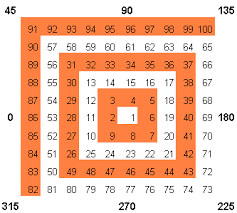
Cardinal Cross and Ordinal Cross
The next sets of important numbers fall within the cardinal cross and the ordinal cross.
The picture below shows the cardinal cross, represented in the blue horizontal and vertical lines. The ordinal cross numbers are represented in the yellow cells.
The numbers that fall in the cells represented by the cardinal and ordinal cross are key support and resistance levels.
While both are important, the ordinal crosses are of less significance and can be breached at times.
Each degree is a representation of time.
Above is a standard 1x1 chart. As an example, if price made a high of 54 on the day, if price retreats, the next support is 29, as it is the next closest number across the square of nine.
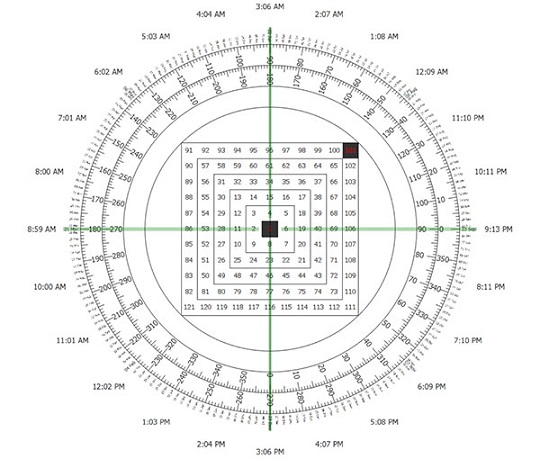
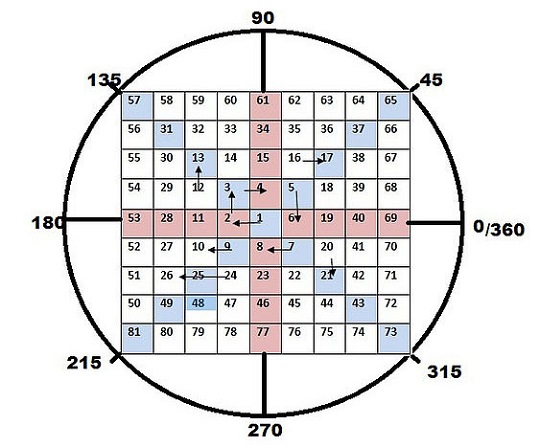
Circle Around the Square
Also, drawing a circle connecting the four corners of the squares brings the concept of angles into perspective. The angles, measured by degrees can point to potential support and resistance levels when the price is said to be moving within an angle.
The chart below shows the Gann square of nine with the circle plotted around it.
Using the Gann Square
To use the Gann chart, simply replace the starting number 1 with a number of your choice and the desired step value. In the above example, the increment is 1, but you could use larger or smaller values.
The resulting numbers in the ordinal and cardinal number cells are key resistance and support levels.
Based on this information, traders can look to either buying or selling into the nearest support or resistance level.
Gann’s square of nine also factors in planetary movements and the degree of price movement based on the circle.
There is a big difference between forecasting prices and trading. For example, one can forecast that the Emini S&P500 will rise to 2100 within a certain period of time. What the forecasting won’t tell you is whether the move to 2100 will be straight, or if the price will fall by a significant number of points before rising to 2100 and so on.
These might seem insignificant when it comes to forecasting, but they can be very things that can define a successful or a bad trade.
Gann Wheel APK
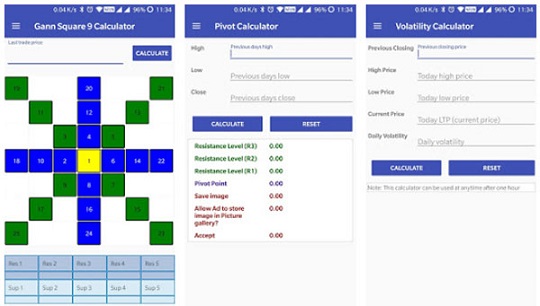
Gann Square 9 Calculator
Intraday Trading Using GANN Square Of 9, Simplest Procedure to day trading using W.D.Ganns Method is described. NIFTY Gann Square of 9 Calculator This app will help you calculate Pivot Points manually by entering the values yourself. Gann Square of 9 for Intraday stock / commodity trading this Calculator is belonging to the theory of W.D. GANN's Square of 9. Gann based his trading methods on time and price analysis. This made it possible for Mr. Gann to determine not only when a trend change was imminent, but also what the best price would be to enter, or exit that market. He made 286 trades in a period of 25 market days. Of these, 264 trades were profitable.
1. This calculator is meant for trading only intraday.
2. Enter the Late trade price of any stock / index/ underlying anytime during the market hours.
3. After entering the price, click calculate button.
4. You will get the buy and sell recommendations.
5. Follow the recommendations you get to trade.
NIFTY gann method of day trading, NIFTY swing trade using gann method, NIFTY W.D Gann Square of Nine Intraday calculator
Day trading?
Gann calculator is meant only for intraday trading.Gann Day Trading Calculator can be used for finding Buy and Sell Levels of Stocks, Options, Futures and Commodities for Intra day trading.
Gann Software for daytrading is meant only for disciplined traders.
Only traders who can make timely decision can use it.
Traders who are not willing to book loss need not use it.
When levels are maintained for long time, quit the trade.
Select only stocks with high volume and sharp movements.
Timing is more important. Begin the trade 15 minutes after the market opens for regular trade. Square off your positions at least 5 minutes before the market closes.
To do intraday trading using this calculator, enter the LAST TRADED PRICE of the previous day and Click CALCULATE button.
Professional traders can initiate trade even during the market hours when new levels are crossed or breached.
Intraday Calculator Collection
- GANN Square Of Nine
- Pivot Calculator
- Volatility Calculator
Analysis and Trading
W D Gann is a legendary name in the world of stock and commodity trading. Gann was supposedly one of the most successful stock and commodity traders that ever lived. Born in Lufkin, Texas on June 6, 1878, W.D. Gann began trading in the early 1900’s, and in 1908 moved to New York City to open his own brokerage firm, Gann & Company. Using his own style of technical analysis, W.D. Gann was reported to have taken more than 50 million dollars in profits out of the markets.Psychological Framework
Master yourself
- Do not overtrade
- See if your trade is based on hope or logic and systems developed by you
Trading strategies
Have different strategies for the four situations:
- Bull market
- Bull market top i.e. reversal from bull to bear market phase
- Bear market
- Reversal phase from bear to bull market
Importance of number 3
Majority of moves will generally occur in time period of three – days, weeks or months. Never trade in the direction of the trend on its third day.
Tops, bottoms and consolidations
- Tops usually take time to form. Spike tops are less common compared to spike bottoms. Tops are marked by extreme movements in medium and small stocks. They will rise by even 20% in a day. These are called blow offs. Because of this short-selling on extreme top is risky.
- Divergences will appear at the top but they cannot be used for timing the trade. Time cycles shall indicate when the actual reversal will start.
- In bull market watch for a correction which is greater in both price and time than the previous corrections in the move up. (Opposite in the downmoves).
- Highest probability of support is that the corrections in the uptrend will all be very close to equal.
- Swing objectives – add the range to move to the top of that move to find out the target for the next upmove or reverse in the bear market.
- Square of numbers and 50% of the difference between those squares are significant support and resistance, but cannot be traded by themselves.
Gann says that there can be nine mathematical proofs of any point of resistance
1. Angles from top and bottoms
2. Angles running horizontally i.e. the previous tops and bottoms
3. Time cycles (vertical angles) (Press a short sale if there are three or four days
of sideways movement after a high day and this is followed by a down day with
high volume where low is lower than the low of the sideways movement and
when this coincides with expiry of time cycles)
4. Crossing of important angles originating at zero
5. Crossing or coming together of angles from double or triple tops or bottoms
6. Crossing of double or triple tops or bottoms
7. Past resistance/ support
8. Volume of sales
9. Squaring of time and price.
Weak stocks will generally not rally until either a test of the first bottom or a higher bottom is made by the market. (That is why AD line is a lagging indicator and generally moves up in the third wave)The third move trying to break the consolidation top/bottom is the most important. If it fails, a fast move in the other direction may be expected.
False breakouts from consolidation result in very fast moves. False breakout occurs when a move outside the consolidation zone fails to sustain in the following week and where the price has not gone beyond three points above the top. These false moves start with high momentum.
A breakout from a three-four day consolidation in a very narrow range results in sharp three day move.
Faster moves start from third of fourth higher bottom. It will be strong move if there is space between the third or fourth bottom and the previous top.
Trend and trend following techniques: In fast advancing markets, in the last stage of the campaign, reactions get smaller as stocks work to higher level, until the final run has ended. Then comes a sharp reaction and a reversal in the trend. Same happens in the bear market. Once you are convinced that a trend is in force, do not wait too long to go with the trade. Early in the trend buy/sell a stock which is already strong/weak. Fast moves generally come from bear market bottoms. These moves usually run three weeks up, then move sideways three to five more weeks, and then accelerate followed by another sideways movement. Under fast moves the first signal to trend change is overbalance i.e. reaction gets larger compared to the earlier ones, specially in the fifth wave. Watch the changes in momentum of price – is the market/stock gaining less points in more time? If the market is trending up, then it should go up more time than it goes down. And vice versa.
Any reversal pattern should be seen in conjunction with the time cycles. Do not pay attention to the financial press.
Use simple trading filter of not entering the market on the third day of the move.
The Cycle of years : Seasonality
Watch for significant days in solar year – Dec. 22, March 21, June 22, Sep 21/23 etc. and days on important angles from these days e.g. 15 days from Dec. 22 i.e. Jan 5-6, Feb 5, May 6, July 7, August 8 etc.
Important count of days: Significant changes in trend may take place on the following days from the significant highs/ lows – 30, 45, 60, 90, 135, 150, 180, 210, 225, 315, 330 and 360.
These are calendar day counts: Trading day counts are 11, 22, 33, 45, 56, 67, 78, 90, 101, 112, 123, 135, 146, 157, 168 and 180. True understanding of cycles are obtained from the calendar days.
Important count of weeks: 13, 26, 39, 45, 52, 78. 7 week period is considered as death zone. Important count of months – 6, 12, 144.
Geometric Charts, angles and price squares: 365 days is an important cycle of one year. In a circle there are 360 degrees which very nearly correspond to this cycle. In other words, one day is equal to one degree of the circle that the earth makes around the sun. Hence the significance of the important divisions of the circle (into angles) on the chart. These angles are 45, 90, 120, 135, 180, 225, 240, 270, 315 and 360.
Dividing a line parallel to the 90 degree division of the circle we get a square. Divisions of this square gives important angles on the charts.
There are two kinds of cycles: Time cycle or natural cycles and cycles derived from the significant prices. And these cycles will have important divisions on 1/8, 1/4, 1/3, 3/8, 1/2, 5/8, 2/3, 3/4 and 7/8. Thus the 30 year time cycle will be divided into important probable turning points as follows:
1/8 – 3.75 years
1/4 – 7.5 years
1/3 – 10 years and so on.
The significant time cycle/squares are Square of 52 on weekly charts. Use it on important high/low as well as on those points which start a 90 day cycle. Also two squares or a cycle of two years can be used. Inner squares (squares formed within the square) and outer squares (squares of the same size placed adjacent or diagonal to the square) should also be seen when price moves into the same.
Square of 90 is also important – in the same manner as square of 52 on weekly charts and monthly charts.
Square of 12 is important. Multiples of 9 are also important to watch.
Square of 144 is the most important square for use on monthly charts. These cycles have influence on price in terms of absolute numbers in addition to the time cycles they signify. It means that a movement of 144 point in a stock is important by itself.
The further divisions of time and price are derived from this master chart as follows:
144*144 = 20.736.
The important divisions are
Div. Days Weeks Months Years

1   20.736 2.962  682  56.8
1/2 10.368 1.481  341  28.4
1/4  5.184 .740   170  14.2
1/8  2.592 .370    85   7.10
1/16 1.296 .185    43   3.55
1/32  .648 .093    21   1.77
1/64  .324 .046    11  0.89
Weekly and monthly time cycles are the most important cycles.
- In the short term, watch 3.5 day i.e. the 3rd / 4th day from the important top / bottom for change in minor trend. It may become a beginning of a major trend.
- Reactions will often last for two or three weeks. Therefore watch 14th day and 21st day along with the 7th day from the important top/ bottom. Out of these 14th is the most significant and 21 the next. (Note that 14 is very close to 13 and 21 is Fibonacci number itself).
- 1/16 of the year is 23 days. Watch for this too.
- Square of 7, 49 is very important for change in trend.
- Watch for a change after 42 days (2×21), but the change may not occur until 45th-46th day. (I have noticed that on many charts of A group stocks 42 day or near about fixed time cycles are important. These numbers, very close to each other, gives some flexibility in analysis, Fibonacci numbers plus minus a few days).
On yearly charts, 90 year, 60 year, 30 year, 20 year, 10 year, 7 years and their multiples and 5 year cycles are important to watch especially the simultaneous end/beginning of these cycles.
1/3 years from any top/bottom when combines with 1/2 or 1/4 years from any other top/bottom becomes very important. 1/2 of the year is the very important – same as the half of the range/high. Anniversaries, however are the most important. 39 weeks and 17 weeks and 35 weeks are also important.
The cycles derived from prices are based on High, Low and Range (i.e. difference between high and low). The most powerful is the square of the range. The absolute number at high, low or that of range is assumed to be forming a time cycle with so many days, weeks or months. In other words, a high at 60 means a time cycle of 60 days/weeks/months. All the division as mentioned earlier will be applicable to this
cycle.
Thus a cycle derived from prices will have two axis – Vertical price axis and horizontal time axis. Significant changes can be expected at important divisions of price or time. But the most significant changes should be expected at the angles made by combining the two. These angles are made on the square of the price. Here square does not mean price raised to the power of two. This is the geometrical square where the length of one side is equal to the price. The square is drawn down from high and up from low.
The square of range can be made down from top or up from low. In a square of high at say 60, drawn on daily graph will have its corners at the following four points – 1) at the price (at 60) 2) at the price (at 60) 60 days away in future i.e. 60 on price axis 60 days
to the right on the time axis from the day on which the price has reached 60. 3) at zero on price axis just below the high and 4) at zero 60 days to the right of point 3.
If the price moves down one point each day the price will reach to the point 4, i.e. 0 on the 60th day. This action is called squaring off of the price. The angle of fall will be 45% on the square. This is also referred to as 1×1 angle i.e. fall of one unit in one day. In same fashion we can draw angle 2×1 i.e. fall of two units in one day and so on. The most significant angles are 2×1, 1×1 and 1×2. These angles are drawn from point 1, 3 and the mid-point between 1 and 3 and the mid-point on 2 and 4.
Crossing over of the angles drawn on the square are considered probable turning points. Angles from 50% mark should always be seen.
When the price breaks below 45% angle line it signifies a weak position and indicates a decline to the next angle. If it again crosses the 45% angle it is said to have regained its strength. At the crossover of these angles distance from the base i.e. the day of high/ low is important. Larger the distance, more powerful the trend is likely to be.
1/2 is the most important level. This is the centre of gravity. If the price falls below this level and bounces back to touch this level again, on the first such occasion it is good set up to shortsell. If the price comes to 50% of high and 50% in time, it may be a high probability buy which may result in 3 months fast move up on the weekly chart.
The third time against any support or resistance zone is the dangerous time.
The 1st, 2nd, 3rd, 4th, 7th, 9th and 12th squares are the significant squares of lows but
all should be monitored. (i.e. the price levels at 2,3,4,7,9,12 times the low).
- The first year of a decade is the year to look for a bear campaign to end and ull market to begin.
- The second year, is a year of a minor bull market or a bear market rally.
- Year three is the start of bear year, but the rally from the second year may run into March or April, or if the second year is a decline, the decline from the second year may run down and make bottom in February or March of the third year.
- Year four is to be a bear year, but it ends the bear cycles and lays the foundation for a bull year.
- Year five is the bull year, the year of ascension.
- Year six is a bull year in which the bull campaign which started in the fourth year usually ends in the fall.
- Year seven is a bear year (but note that 1927 was at the end of a 60 year cycle and that there was no decline).
- Year eight is a bull year. Prices start advancing in the seventh year and reach the 90th month of the decade in the eighth year. This is very positive and a good advance usually takes place in this year.
- The ninth year of the decade is the strongest of all bull years for bull markets. The final bull campaign culminates in this year after an extreme advance, and the prices start to decline. The bear market usually starts in September to November.
- Year ten is a bear year. A rally often runs until March or April, then a severe decline takes place until November or December, when a new cycle begins and another rally starts. (Look for such cycles in the Indian indices).
In a strong rally the lows of the reaction end above the top of the previous rally. The duration of the quick counter trend moves is three to four days on the indices and three to five days on the stocks. A movement exceeding the fourth day indicates the trend may go into a consolidation or reversal whereas reversal is higher top and higher.
bottom compared to the previous day or vice versa. Bar reversals at cycle ends are extremely important points for reversal in the trend. A stock or commodity can correct more than four days and then continue the trend. This next correction (countertrend) in time will likely be seven to ten days.
- Smallest complete cycle is 5 years.
- Minor cycles are 3 years and 6 years.
- Always watch for change in the 59th month.
- Bull or bear campaigns seldom run more than 3-3.5 years up or down without a move of 3-6 months of one year in the opposite direction, except at the end of a Major cycle, like 1869 and 1929. - Many campaigns culminate in the 23rd month.
The purpose in trading is not to make pick exact highs and lows. The purpose is to make money. Always have a plan. The opportunities are many in the markets, and you will miss many. But do not worry or fret about missing an opportunity, as another will be along shortly. Trade from a plan and do not react to the markets. Knowledge, discipline, courage and hard work are the requirements of skillful trading.
Conclusion
To conclude Gann Wheel works on Windows operating system(s) and can be easily downloaded using the below download link according to Shareware license. Gann Wheel download file is only 365 KB in size.Gann Wheel was filed under the General category and was reviewed in softlookup.com and receive 5/5 Score.
Gann Wheel has been tested by our team against viruses, spyware, adware, trojan, backdoors and was found to be 100% clean. We will recheck Gann Wheel when updated to assure that it remains clean.
Gann Wheel user Review
Please review Gann Wheel application and submit your comments below. We will collect all comments in an effort to determine whether the Gann Wheel software is reliable, perform as expected and deliver the promised features and functionalities.Popularity 10/10 - Downloads - 44844 - Score - 5/5
Softlookup.com 2023 - Privacy Policy
| Category: | General |
| Publisher: | globalviewtech.com |
| Last Updated: | 16/10/2023 |
| Requirements: | Not specified |
| License: | Shareware |
| Operating system: | Windows |
| Hits: | 18492 |
| File size: | 365 KB |
| Price: | 59.00 USD |
| Name: * |
E-Mail: * |
| Comment: * |
|