Web based School
|
The Visual Data Tools provide a rewarding experience for the developer who is
building an integrated database application. I bet you didn't know that "database
programming" and "rewarding" could be found in the same sentence.
Visual InterDev makes this possible through the use of visual tools that simplify
the process of creating database functionality in your application. You received
an overview of the Visual Data Tools during the first week. YesterChapter, the lesson
presented the Query Designer as one of the Visual Data Tools. ToChapter's lesson provides
an in-depth look at several members of the Visual Data Tools family. The lesson focuses
on how to use the programming aspects of the tools to provide database interaction
within your application. To begin the Chapter, you will learn how to use the Query Designer to build and construct
your SQL statements. I will walk you through some examples of query construction
within the context of a Web-based application. The lesson builds on the principles
that you learned yesterChapter. Next, you learn how to use the Query Designer to modify
the SQL statements that have been generated. This section targets those developers
who need full control of their database code. You also will learn how to test the
results of your SQL statements to verify that they produce the right results. The
latter part of the Chapter shows you how to integrate stored procedures and triggers
into your application. You also will discover how to enter and manipulate the contents
of your database. The final lesson for the Chapter covers the Data Command Control and
shows you how to use this database design-time control to com-municate with the database.
On Chapter 8, "Communicating with a Database," the lesson walked you through
an example of setting up a database connection. ToChapter's lesson continues with that
example to show you how to use the connection once it has been built. I hope that
you had a chance to practice using the Query Designer on your own during yesterChapter's
Workshop. In the following sections, you are guided through several examples of how
to use the Query Designer to select, insert, modify, and delete your data. I will
be using the data source that I established yesterChapter, which means the example will
be using the sample Pubs database included with MS SQL Server.
The Query Designer works in conjunction with the Data View to enable you to access
your data. To use the Query Designer, you must establish a connection to a data source.
After you have established this connection, you're ready to begin communicating with
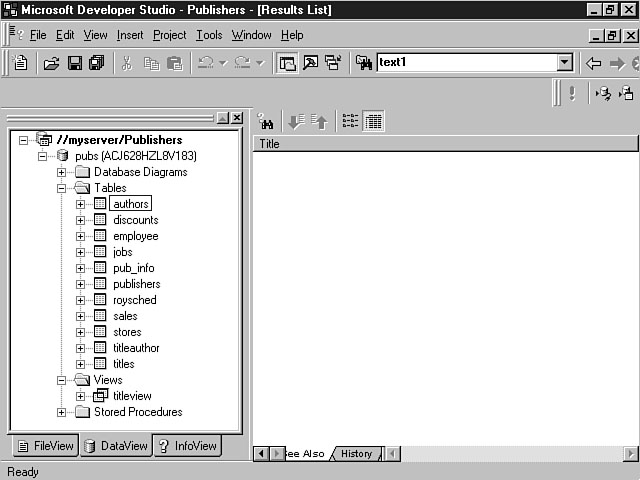
your database. I established a MS SQL Server connection to the Pubs database and
named it Publishers. Figure 9.1 displays the tables, views, and stored procedures
that are contained within this database. The Pubs database.
Each type of database object is represented by a folder that describes its meaning.
For example, the database tables are displayed in the Tables folder. You can open
a table by selecting a table and pressing the right-mouse button to display the shortcut
menu. You can then select the Open menu item. This action selects the entire contents
of the table and presents the rows in the Results pane to the right of the project
workspace. Figure 9.2 depicts the contents of the Authors table when it's opened
using this method.
Once you have opened a table, you can use the Query Designer toolbar to create
and view your queries, as well as to see the results. Opening the Authors table.
You learned about the four panes of the Query Designer during yesterChapter's lesson--the
Diagram pane, the Grid pane, the SQL pane, and the Results pane. Each of these panes
is represented by a toolbar icon that you can use to display a particular view. Figure
9.3 illustrates the available options of the Query Designer toolbar. The Query Designer toolbar. The next section provides a brief explanation of each of these icons.
You can use this option to display the Diagram pane. Remember, the Diagram pane
enables you to work with specific tables and views to create your queries. This icon
becomes enabled after you have opened a table or view. When you click this toolbar
icon, the Diagram pane for that table or view is displayed. You can then work with
that table, as well as drag and drop other tables into the Diagram pane.
The Show Grid pane icon displays a view of the Grid pane, which enables you to
customize the SQL statement. For example, you can choose the individual columns that
you want to use in the query or select all of the columns within a table. The columns
that are involved in the query display in the grid. The corresponding table for these
columns also appears. You can enter search criteria for the query. For the rows that
are returned from the database, you can designate ascending or descending order.
You can use this icon to view the actual SQL statement for your query. From the
SQL pane, you can modify the generated SQL statement, as well as create custom queries.
When you click this icon, the Results pane is displayed. This pane reveals the
results from the database based on your query. From this pane, you can directly modify
the database information. You also can add and delete database rows.
This icon enables you to create a new row for a table by copying data from an
existing row within the table. You also can create a new row for a table by copying
a row of data from one table into another table. If you use this feature, you generate
an INSERT INTO SQL statement.
This icon enables you to create an update query for a table. You can use this
feature to update and change the values of a column or columns for one or more rows
in a table. The resulting SQL statement will be an UPDATE statement.
You can use this icon to delete one or more rows from a table in your database.
This query generates a DELETE SQL statement.
This option enables you to test the validity of your SQL statement. You can use
this option before you run your SQL statement to ensure that the syntax is correct.
When you click this toolbar icon, the Query Designer tests your SQL statement against
the data source. If the SQL syntax is accurate, you receive a confirmation message.
If the SQL statement is incorrect, a message displays, indicating the syntax error
as well as where the error is located.
The Run toolbar icon enables you to execute your query against the database. You
can view the results of the query using the Results pane.
The Remove Filter option enables you to remove any special search criteria conditions
that have been specified for the query. This option works in conjunction with the
Diagram pane. After you select a field that contains a search criteria filter, the
Remove Filter icon becomes enabled, allowing you to remove the conditions that have
been created for this query.
You can click the icon to view your results in ascending order. The Sort Ascending
toolbar option works in conjunction with the Diagram pane. This icon becomes enabled
after you have selected a field within a table that is displayed in the Diagram pane.
After you click this icon, an SQL statement is created, sorting the query in ascending
order for the field that you select. You can choose multiple fields to help construct
the sort.
You can use this feature to view your results in descending order. The Sort Descending
toolbar option works in conjunction with the Diagram pane. This icon becomes enabled
after you have selected a field within a table that is displayed in the Diagram pane.
You can choose multiple fields to help construct the sort.
When you click this toolbar option, you can view and change overall properties
for the query. For example, you can select to display all of the columns for the
tables within a query. You also can choose to view only distinct rows. This option
enables you to avoid duplicate rows when you perform a query that joins two tables.
Now that you have learned some of the basics about using the Query Designer, you're
ready to create your first query. This part of the lesson covers how to combine features
of the Query Designer panes and menu options to rapidly build queries for your applications.
The main types of queries are discussed, including selecting, inserting, updating,
and deleting data. You are shown how to perform each of these functions using the
Query Designer.
First, you need to select the tables that you're going to use to create the query.
Earlier in the Chapter, you learned how to open a table. You also discovered the Diagram
Grid, which enables you to choose the tables that you want to use for your query.
In this first example, I use two tables from the Publishers database to demonstrate
the features of the Query Designer. The first step involves selecting the table or view that you want to use in the
Diagram pane. Using the Data View, click the left mouse button on the particular
table or view. With the desired table highlighted, hold down the left mouse button
and drag the mouse over to the Diagram pane. The mouse pointer displays the table
icon when you have reached a valid spot to place the table. To drop the table into
the Diagram pane, release the left mouse button. The selected table is positioned
in the Diagram pane. Repeat these steps for each of the tables and views that you
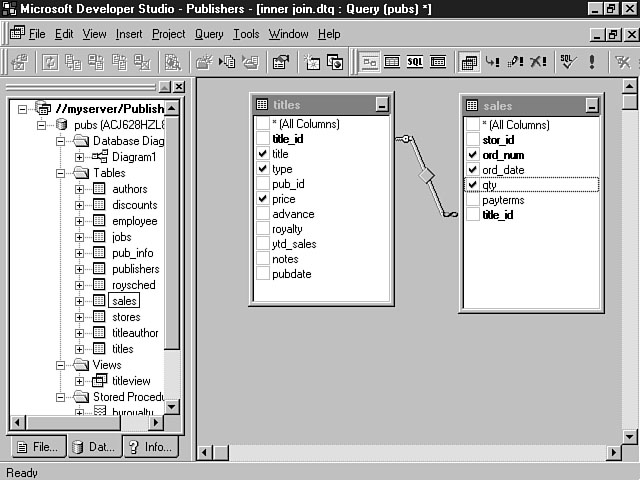
want to use to build your query. In my example, I have selected the Titles and Sales
tables. Figure 9.4 shows these two tables within the Diagram pane. As you can see, the name of the table is displayed along with the fields. You
can use the shortcut menu to display only the name of the table. A join line also
is displayed, defining the relationship between the two tables. The join line is
composed of two components--the join type and the join relationship. Table 9.1 displays
the possible types of joins and a definition of each type. Selecting the tables.
Table 9.2 shows the possible join relationships and their meanings.
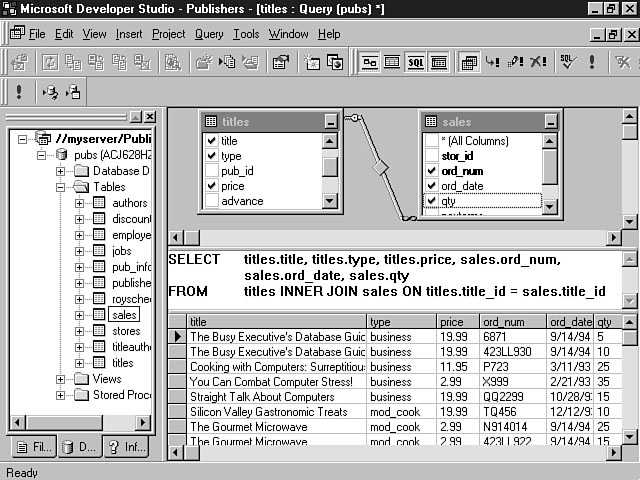
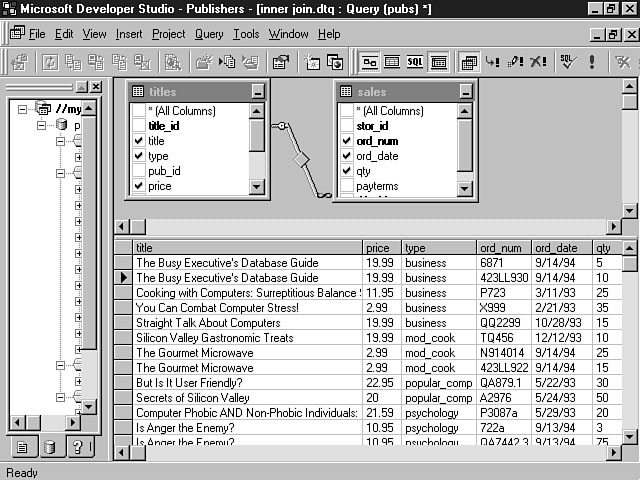
A brief explanation of joins is warranted here. By default, the Query Designer
creates an inner join between the tables, if possible. An inner join only returns
a related set of rows between the tables. In the following example, the Titles and
Sales tables were selected. The Query Designer created an inner join between these
two tables and generated the following SQL statement: Figure 9.5 shows the Diagram, SQL, and Results panes for an inner join between
the Titles and Sales tables. Notice that the inner join is based on the title ID field. If the title ID of
the Titles table is equal to the title ID of the Sales table, the resulting row is
displayed in the result set. Rows in either table that don't have the same title
ID aren't returned from the database. In other words, sales information is displayed
for each title that contains this information. If a particular title hasn't generated
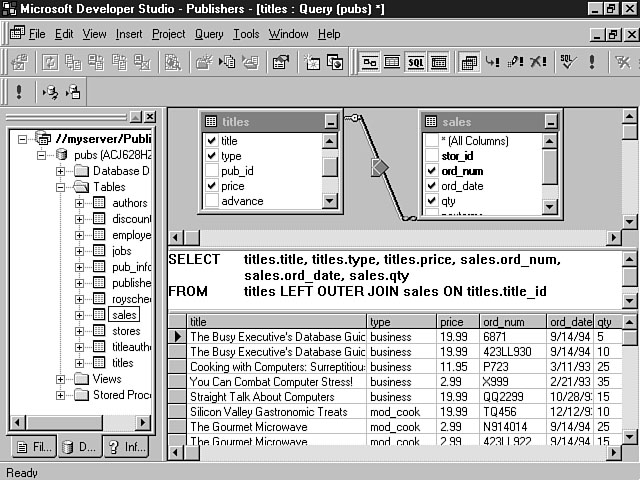
a sale, the title isn't displayed. An example of an inner join. An outer join differs from an inner join in that an outer join can return rows
that don't have related, or matched, rows in the joined table. The inner join only
displays related rows between the tables. The outer join displays rows that fall
outside the relationship based on the type of join. You can create three types of
outer joins. The left outer join includes unmatched rows in the result set that are
displayed in the left table, or the table that is specified first in the join statement.
Figure 9.6 shows the Diagram, SQL, and Results panes for a left outer join between
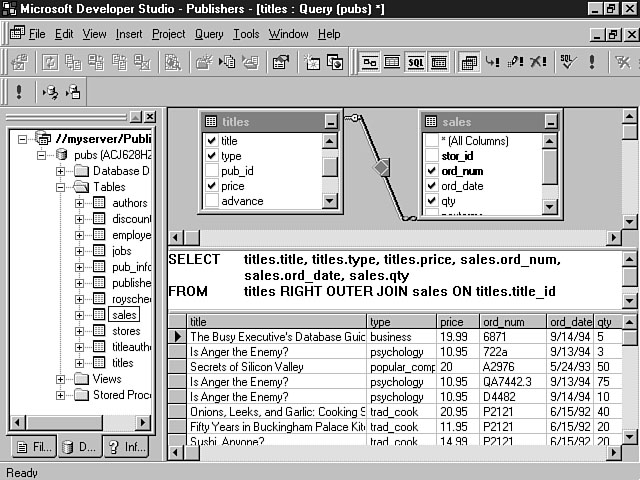
the Titles and Sales tables. Right outer joins display all of the rows that are included in the right table,
or the table that is listed second in the join statement. Figure 9.7 shows the Diagram,
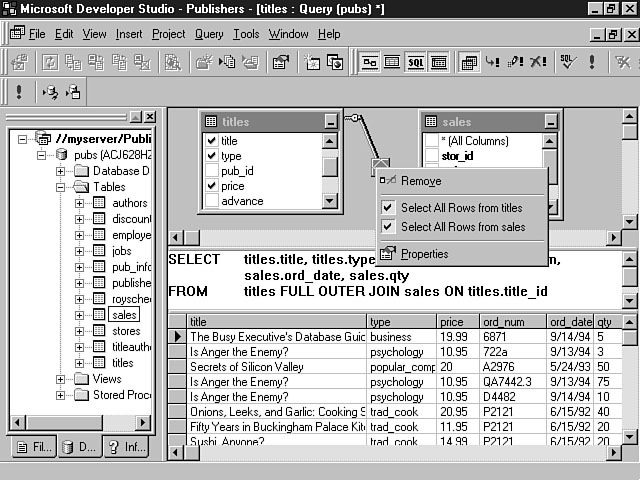
SQL, and Results panes for a right outer join between the Titles and Sales tables. The third type of join is the full outer join, which displays all rows of all
tables whether the rows have matching data or not. Figure 9.8 shows the Diagram,
SQL, and Results panes for a full outer join between the Titles and Sales tables. The Query Designer lives up to its visual nature by providing a way to easily
designate the type of join you want to create. In fact, this visual feature enables
you to create these joins without having to know the types of joins or their meanings.
To change the type of join, click the mouse on the join line between the tables.
The line becomes bold, indicating that this object has the focus of the mouse. You
can then display the shortcut menu for the join line by pressing the right mouse
button. Figure 9.9 displays the different options that you can select to change the
type of join for the query. An example of a left outer join. An example of a right outer join. An example of a full outer join. Displaying the shortcut menu to create a join. In Figure 9.9, you should notice that there is no mention of the word "join"
in the list of menu items. The options are in plain English and describe the type
of action that you are trying to accomplish. In this example, you can choose to display
all of the rows from the Titles table (a left outer join). You also can choose to
select all of the rows from the Sales table (a right outer join). Notice that these
menu items are checkboxes, which means they aren't mutually exclusive. In other words,
you can select both items at the same time, thereby creating a full outer join. This
feature provides a very intuitive way to achieve the correct results for your queries.
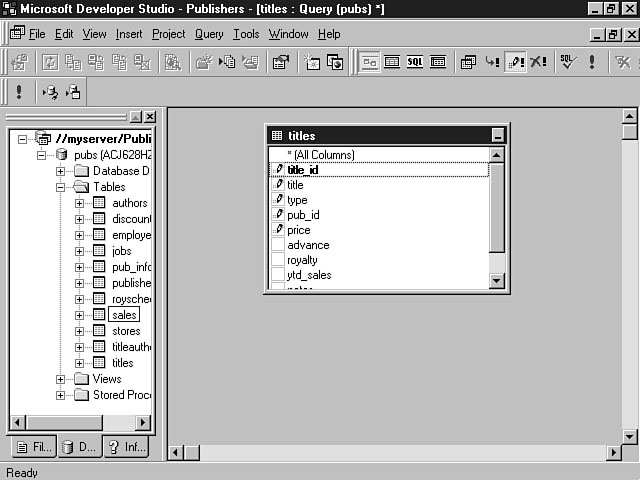
After you have selected the tables for your query, you need to choose the columns
of the tables that will have an effect on the query. You may use these columns to
display the results of the query in addition to specifying the parameters for your
query. You can choose individual columns by clicking the left mouse button in the
box located to the left of the column name. Finally, you can select the All Columns
option to include all of the table columns in the query. All of the choices that you make in the Diagram pane are immediately reflected
in the Grid and SQL panes. For example, if you choose three columns from the Titles
table and two columns from the Sales table, these columns are reflected in the Grid
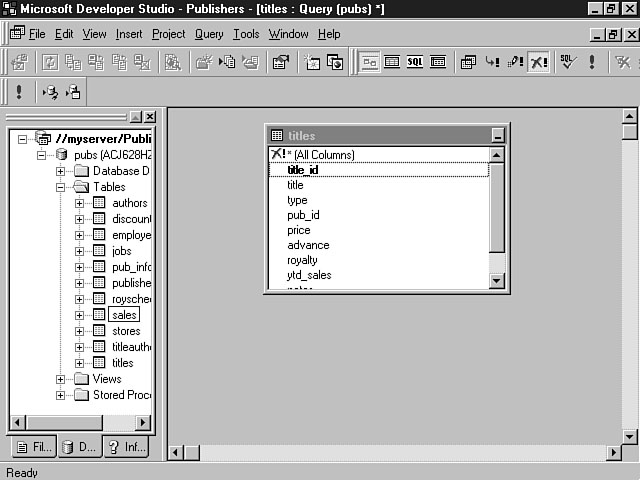
pane and inserted into the SQL statement. A symbol visually indicates how the column is being used in the query. In Figure
9.9, the columns contain a checkmark in the checkbox to the left. Figures 9.10 through
9.12 demonstrate the indicators for the other types of queries. Indicating an insert query column. Indicating an update query column. Indicating a delete query column.
Several other symbols are displayed to the right of your column names. Table 9.3
illustrates these symbols and their meanings.
Continuing with the example, I chose the Title, Type, and Price columns from the
Titles table and the Ord_Num, Ord_Date, and Qty columns from the Sales table. Figure
9.13 displays these choices within the Diagram pane. Selecting the columns.
So far, this lesson has taught you how to use the Diagram pane to construct a
basic query. In the example, I chose to create a query that displays the title, price,
type of guide, order number, order date, and quantity of the order. The next step
runs the query. Remember, to execute a query, click the Run icon from the Query Designer
toolbar. You also can click the right mouse button in the Results pane. This action
displays the shortcut menu for the Results pane, enabling you to choose Run from
the menu item list. Figure 9.14 shows the rows that are returned from the database
when I execute this query. You can see from Figure 9.14 that several rows were returned from the database.
The columns, however, aren't in the most intuitive order. For instance, the order
number and order date fields are displayed too far to the right. A more useful way
of organizing the data is to display these order information columns first and then
the title information. You will discover in the next section how to further customize
this initial query. Examining the results.
You received a brief introduction to the Grid pane yesterChapter. This pane enables
you to work with the columns in the tables to further customize the query. Initial
columns that you selected using the Diagram pane are displayed as rows within the
grid. You can add to this list of columns as well as delete the columns that have
been selected. To add a column to the query using the Grid pane, place the cursor
in the column named Columns on an empty row. You can then choose a column from the
tables you have selected from a drop-down listbox.
To delete a row, click the box to the left of the Column name to select the row.
The row is highlighted, enabling you to click the DEL (Delete) key or to choose Delete
from the Edit menu to delete the row. Deleting a row removes the column from the
query.
Any changes that you make to the query using the Grid pane are instantly reflected
in the Diagram and SQL panes. The next sections outline the Grid pane options that
you can use to customize your queries.
The order in which the columns appear in the grid on the Grid pane determines
the order that the columns will be displayed in the results for your query. This
order is determined by the order in which you selected your columns in the Diagram
pane. You can change the order of these columns by selecting a row and moving it
to the new location within the rows in the grid.
Many times, the name of the database column isn't a very user-friendly name. This
is especially true if you have cryptic naming standards for defining your table columns
that only a database administrator can understand. The Alias column within the Grid
pane enables you to create an alias name for the column that is displayed with the
result set. You can define a more intuitive name for the column that can be presented
to the user. You also can use an alias for columns that are computed based on the
values within your table columns. For example, you may want to create a query that
displays the price and quantity for certain guide orders. Because the order total
changes frequently, this value isn't stored in the database. You could create an
alias column that computes the total value of the order from the Price and Quantity
columns and displays this total for each row. To enter an alias, type the new name in the Alias field next to the column that
you want to rename. The alias that you enter is then used to display the results.
In the example, the column names for the order number, order date, and quantity aren't
very intuitive. I changed the names of these fields by using the Alias column. Figure
9.15 shows the new names for the fields as they are displayed in the Grid pane. Providing more useful column names for the user.
The Grid pane enables you to choose the results that you want the user to see
when selecting information from the database. You can use the Output column to designate
whether the column is displayed in the results for the query. This field is checked
by default, meaning that the column is displayed in the query results. You may want
to use columns in a table to construct a query but not display the columns in the
query results. To change the Output column, click the mouse on the field and the
checkmark is turned on or off, depending on its current status.
The next few columns in the Grid pane enable you to customize your query. The
Sort Type field enables you to sort the query using that column. You can specify
ascending or descending for the type of sort. To choose the sort type, place your
cursor in the Sort Type field for a particular column. A drop-down listbox is displayed,
enabling you to pick a sort type from the list. The Sort Order indicates the priority of the columns to be sorted. This column
is in conjunction with the Sort Type field. While the Sort Type field indicates the
type of sort that you want to use, the Sort Order field determines the order in which
columns will be sorted. The first field that you select to sort is indicated by the
number 1. The second field con- tains the number 2, and so on. For example, you may
want to sort the sales data by order date and then order number. To create this sort,
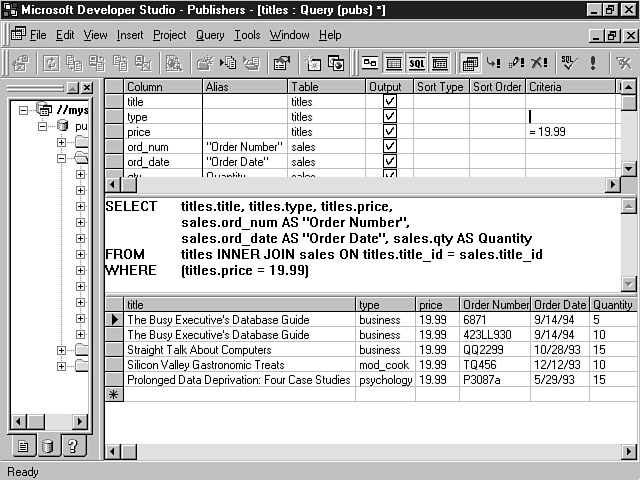
you choose a sort type for the Ord_Date column first and then for the Ord_Num column. The Criteria column enables you to enter special search conditions for the query.
You can use this column to specify that you want the query to find only those columns
that meet your search criteria. The default criteria condition is based on the =
(equal) sign. If you enter a value into the Criteria field for a column, the Grid
pane formats the condition using the equal sign. Figure 9.16 shows the Grid, SQL,
and Results panes using an example of searching for a value that is equal to a column
value. Searching for guides that cost $19.99. In this example, I entered the value into the field, and the Grid pane automatically
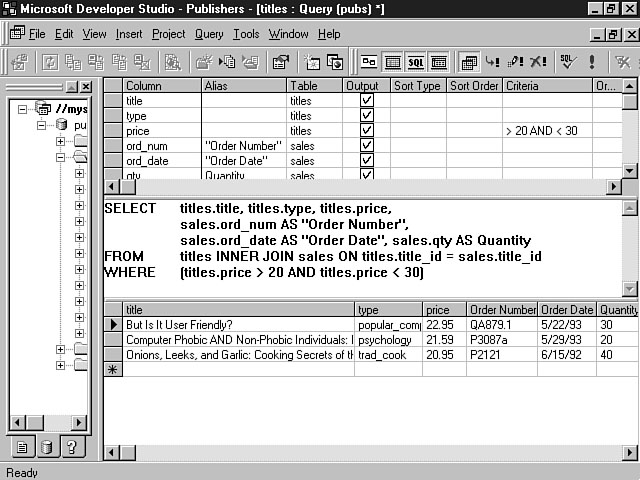
inserted the = sign into the Criteria field. If you want to enter other types of
search conditions, such as greater than or less than, you can manually enter these
conditions, along with the search condition value. As you enter search condition
criteria for multiple columns, these conditions are linked using the AND
statement. The Or column enables you to specify additional search conditions to a particular
column. These conditions are linked together using the OR statement.
You also can enter the logical operators directly into the Criteria column. Figure
9.17 shows an example of this method. Using logical operators to create a query. Notice in this example that the SQL pane creates the appropriate SQL statement,
using the AND logical operator statement based on the choices made in the
Grid pane. The Results pane displays the rows from the database based on this query.
This example demonstrates the interactive nature of working with the Query Designer
to create and construct queries that produce the desired results for your application.
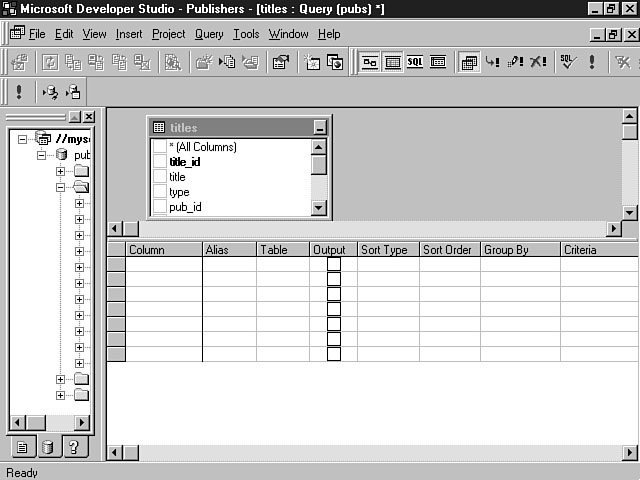
You can use the GROUP BY statement to organize your rows into specific
groups. For example, you may want to create a query that returns the average guide
price for a certain publisher. To create a query based on the GROUP BY statement,
drag and drop the table that you want to work with into the Diagram pane. For this
example, I use the Titles table. Make sure that you have the Grid pane activated
as well. You also can group the results by selecting Group By from the Query menu.
This adds a Group By column to the grid in the Grid pane. Figure 9.18 shows what
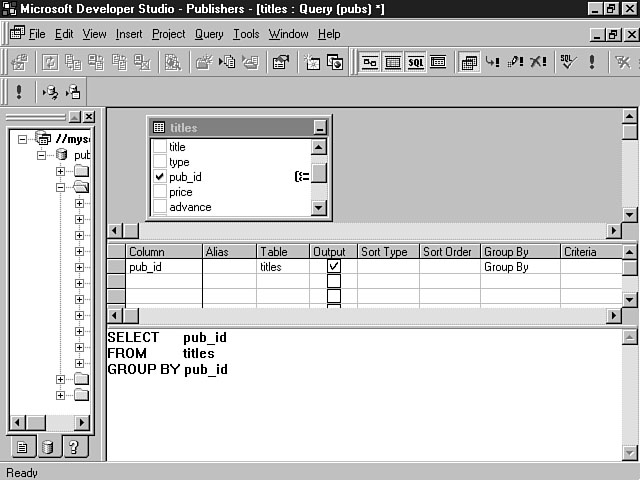
your Query Designer workspace should look like so far. Selecting the table to group. Next, add the column that you want to group by. You can perform this step in one
of two ways. First, you can place your cursor in the Column field in the grid within
the Grid pane and choose the column from the drop-down listbox. You also can select
the group by field by using the Diagram pane. Using this method, click the box to
the left of the column that you want to group by. The column displays a checkmark
next to its name in the Diagram pane. The Query Designer also inserts this column
into the grid in the Grid pane and selects the Group By value for the Group
By column. Figure 9.19 shows what the Diagram, Grid, and SQL panes look like as a
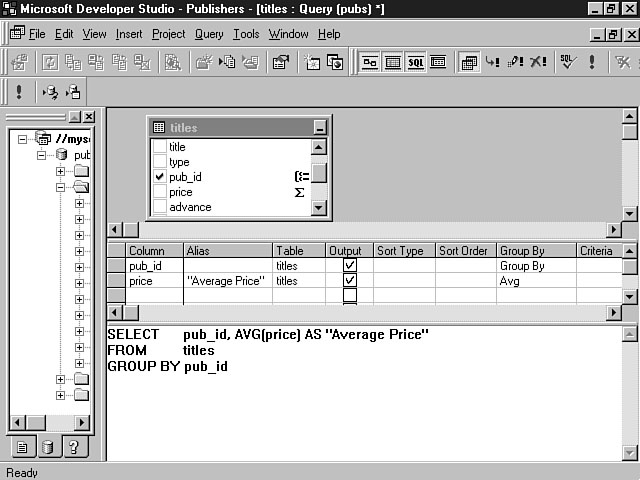
result of choosing the Pub_id column to group the results. Choosing the column to group the results. After you have chosen the column to group the results, you need to add the column
that will average the prices of all the guides for the publishers. This column will
be a computed column that calculates the average, based on information in the database.
It displays the average price in the query results. You can add the column in one of two ways. First, you can add the column to the
Grid pane from the drop-down listbox in the Column field. Place your cursor in the
Column field for an empty row in the Grid pane. Choose the column that will supply
the data for the computed column. Second, you can use the Diagram pane to add this
column, similar to the method you used to add the Group By column in the preceding
example. Click the column that you want to use. A checkmark is placed next to the
name in the Diagram pane, and the field is added to the Grid pane.
For purposes of this example, Average Price is used for the alias name of the
computed column. After selecting the column that will be calculated, you need to
select the computation method. In this example, I select the AVG function.
This function calculates the average price for a particular publisher's guides, based
on the individual guide prices for that publisher. Figure 9.20 depicts the choices
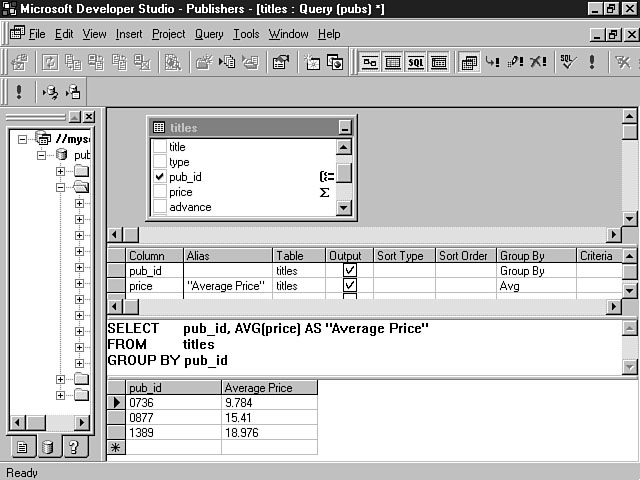
I have made so far within the Query Designer workspace. Choosing the calculation method. You can now run the query to discover the results. Figure 9.21 displays the results
of this query example, using all four panes of the Query Designer. In the previous example, you learned how to group your results and use the AVG
function to calculate an average. You can use the Query Designer to build other aggregate
functions. Table 9.4 lists all of the available aggregate functions and their descriptions.
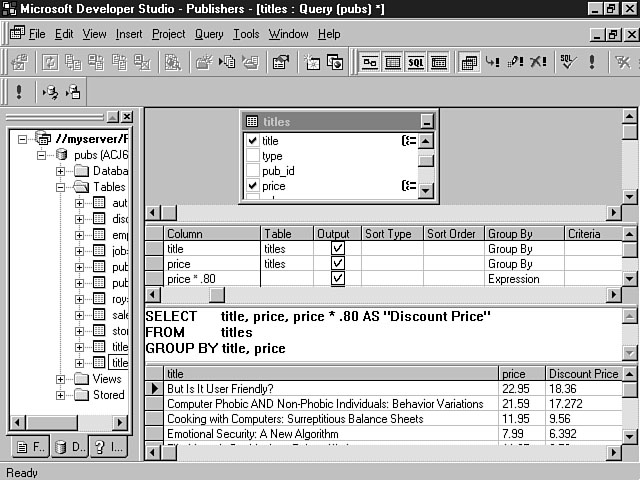
Showing results of average price query. You also can use the WHERE and HAVING clauses to create specific
criteria for your queries. You also can use expressions within your queries. For
example, you might want to calculate the price of a guide by a specific discount percentage.
You could create an expression that multiplied the price times the discount percentage
number to calculate the discount price. Figure 9.22 shows an example of calculating
a discount of 20 percent on all the guides in the Titles table. You can choose the WHERE clause and the Expression options from the drop-down
listbox for the Group By column in the Grid pane. Using an expression to discount the price.
So far, you have learned how to use the Diagram and Grid panes to construct a
select query. You have received an overview of how to use the individual features
of both panes to create your query. You also have discovered how your choices in
the Diagram and Grid panes affect the SQL and Results panes. In this section, you
learn how to apply those techniques to create an update query. An update query enables you to change the value of a column or columns in a row.
You also can create an update query to make changes to multiple rows. The update
query uses the UPDATE SQL statement to execute against a database. The update
query can be very useful when you don't want to manually update individual rows within
a database.
To create an update query, you first need to select the table that you want to
update. This step can be accomplished using the same method that you performed to
create a select query. Select the table from the Data View that you want to work
with to create your update query. Hold down the left mouse button and drag the table
over to the Diagram pane; then release the left mouse button to drop the table into
the Diagram pane. Next, you need to choose the type of query that you're constructing. To create
an update query, click the Create Update Query icon on the Query Designer toolbar.
You also can select Change Type from the Query menu. You can then choose Update to
change the query type to an update query.
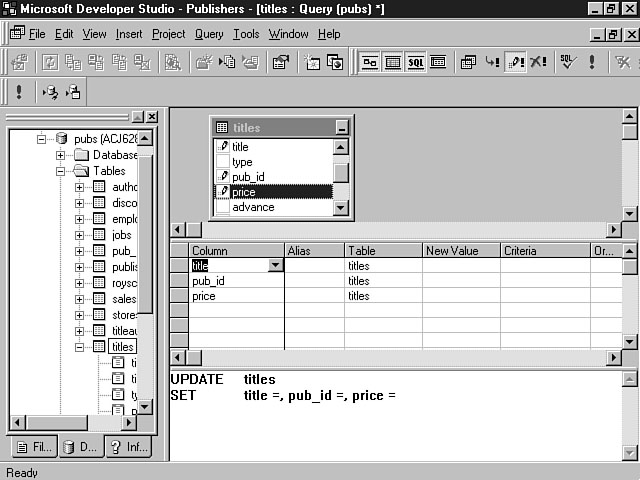
You're now ready to choose the columns that you want to update. Click the box
to the left of each column that you want to use to create the update query. As in
the previous example, these fields are displayed in the Grid pane in the order that
you select them. A pencil indicator is displayed in the Diagram pane next to each
column that you select. For this example, I used the Titles table and have selected several of the fields
to use in the update query. Figure 9.23 displays the Diagram, Grid, and SQL panes
for this update query. Selecting the fields for the update query. Next, you need to use the Grid pane to enter the new values for the columns that
you want to change. The grid for an update query differs from the select query grid
in that the update query grid contains a New Value column. You use this column to
enter the new value for the column you're going to change. You can enter a value,
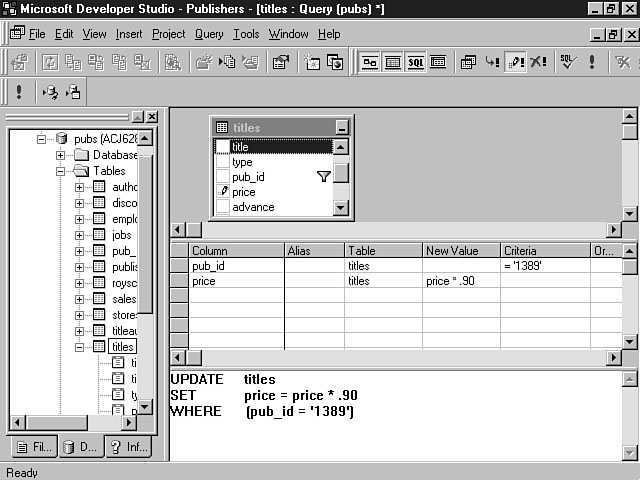
a column name, or an expression in the New Value column. After you enter the update value for the column, you need to specify any special
search criteria for the update query. For example, you could create a query that
discounts the price for all guides for a certain publisher by 10 percent. You need
to enter an expression into the New Value column for this type of update. You also
need to include a special search condition that only updates the rows for that particular
publisher ID. You can enter the search conditions in the Criteria column. The same
search condition rules that apply to the select query also apply to update queries.
In this example, a condition is entered to discount the price by 10 percent for all
guides that have a publisher ID number equal to 1389. Figure 9.24 demonstrates how
this is displayed in the Query Designer workspace. Selecting the fields for the update query.
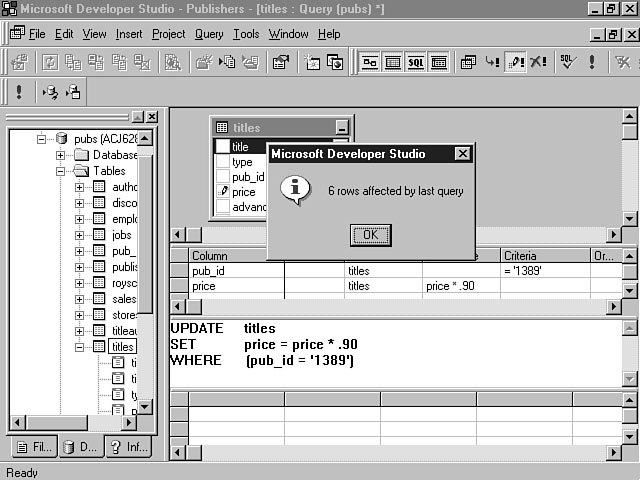
After you have entered the new values for the columns and specified a search condition,
you can execute the query to update the database with new values. Figure 9.25 shows
the results of the update query. Updating the database. When you run an update query, the Results pane doesn't display any rows. Instead,
a confirmation message indicates how many rows were affected by the update.
The update query is useful when you need to perform routine updates for multiple
rows in a database. You can save a lot of time by creating an update query to handle
this task instead of manually updating the rows.
This lesson has focused a lot of attention on how to use the Diagram and Grid
panes to construct your queries. These two panes exemplify the intuitiveness of the
Visual Data Tools. You have seen how quick and easy it is to build your SQL queries.
This section is for those database programmers who want to take control of their
SQL. The Query Designer generates the SQL statements that you need, based on your input.
You can add to and extend these statements by using the SQL pane. This pane shows
you the SQL statements that are created and enables you to modify the statements
directly. The following section walks you through an example of how to use the SQL
pane.
The SQL pane automatically builds the SQL statement based on your choices in the
Diagram and Grid panes. Any changes that are made to the Diagram and Grid panes are
instantly reflected in the SQL pane. You may need to modify the SQL statement that
is generated. For example, you may be a very proficient database programmer who can
create a new query quickly by typing the SQL statement directly into the SQL pane.
You might also want to extend the generated SQL statement to take advantage of some
feature that's specific to the database you're using. Whatever the case, you can
use the SQL pane to create new queries, as well as to modify existing queries. The Query Designer verifies the syntax of your SQL. Figure 9.26 shows an example
of how the Query Designer displays error messages when you have made a mistake in
your SQL syntax. An erroneous custom SQL statement. You can see from the preceding example that the Query Designer has found an error
in the SQL statement. A description of the error is displayed in the listbox in the
Query Definitions Differ dialog window. A message indicates that the query in the
SQL pane differs from the query in the Diagram and Grid panes. You can revert back to the last correct SQL statement, or you can correct the
custom query that you are developing. If you choose to continue developing your custom
query, the Diagram and Grid panes become disabled, signifying that you are creating
a custom query. Pressing Yes on the Query Definitions Differ dialog window enables
you to continue correcting your custom SQL statement, while pressing No cancels the
changes that you have made to the generated SQL statement. Figure 9.27 displays an
example of correcting the custom SQL statement. A correct custom SQL statement. For this example, I pressed the Yes button on the Query Definitions Differ dialog
window to correct the custom SQL statement. Notice that the Diagram and Grid panes
are disabled. The second value for the WHERE clause needed to be enclosed
in single quotes. Also, the table column needed to be specified. After you correct
the error, the Diagram and Grid panes become enabled and reflect the changes you
have made. You can then execute the query to update the database.
In this example, you saw how the Query Designer verified the SQL syntax. This
verification is performed instantly when you use the SQL pane to construct the statement.
As soon as you click another part of the workspace, the Query Designer verifies the
syntax of your custom SQL query. You also can use the Verify SQL Syntax button to
perform this function. You learned earlier toChapter about the Verify SQL Syntax button,
which is located on the Query Designer toolbar. You can use this button to validate
the syntax of your SQL statement.
You can use the Query Designer to create and execute stored procedures for MS
SQL Server 6.x and higher, and Oracle 7.x and higher. Stored procedures were defined
during the first week. Remember, a stored procedure is a precompiled database call
on the server database. A stored procedure is more efficient than embedding your
SQL call within your application. Stored procedures are already compiled and, therefore,
take fewer steps to perform the database query than SQL statements that you pass
from your application to the database. A trigger is a special form of stored procedure
that executes automatically, based on some event. For example, you could use a trigger
to delete all detail sales line items for a guide if the guide in the Titles table
is deleted. While you gain a performance increase by using stored procedures, you give up
portability of your application. Each database vendor implements stored procedures
in a different and proprietary manner. For this reason, you won't be able to port
your application from one database vendor to another if you use stored procedures
and triggers. You need to weigh the costs and benefits of stored procedures to determine
if they are right for your application. This section shows you how to use the Query Designer to execute stored procedures.
There are two ways to call a stored procedure: The first method involves the Data
View, and the second way is to use the SQL pane in the Query Designer. Both methods
are outlined in the following sections.
The first way you can call a stored procedure is by using the Data View. The result
is displayed in the Output pane located at the bottom of the Visual InterDev development
workspace. Both the result set and the return value will be displayed. The return
value indicates an error number. A return value of 0 means that the stored
procedure executed successfully. You can use the Data View to call existing stored procedures. These procedures
will most likely be displayed in the stored procedures folder in the Data View. To
execute a stored procedure using the Data View, open the stored procedures folder
to see the list of available procedures. Select the stored procedure that you want
to call and click the right mouse button to display the shortcut menu. Choose Run
from the list of menu items. Many times, a stored procedure will need certain parameters
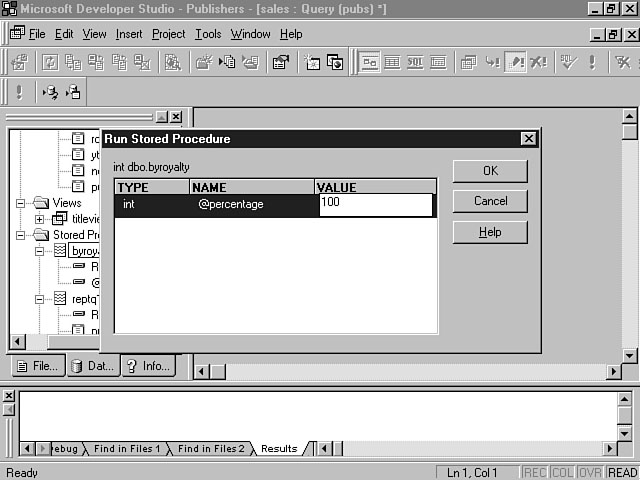
to be able to execute. If the stored procedure requires parameters, the Run Stored
Procedure dialog window displays, enabling you to enter the necessary values for
the procedure. Figure 9.28 displays the window to enable you to enter the parameters
for a stored procedure. Entering the parameters for a stored procedure. The Run Stored Procedure dialog window shown in Figure 9.28 is using the ByRoyalty
stored procedure included with the Pubs database. This stored procedure requires
that you enter a percentage number as its lone parameter. The procedure then returns
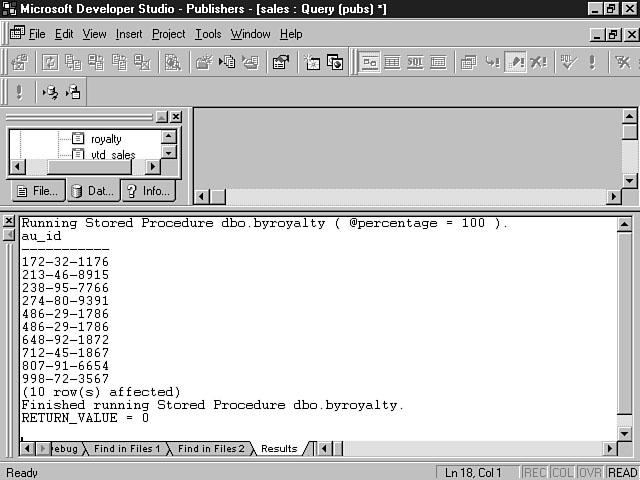
the author IDs that match the specified royalty percentage. The Run Stored Procedure dialog window enables you to enter a percentage for the
stored procedure. Enter the value and then click OK. The Query Designer passes the
parameter to the stored procedure to execute on the database. The results are displayed
in the Output pane, along with the number of rows returned and the return value.
Figure 9.29 illustrates the results of entering 100 for the percentage parameter
and running the stored procedure. Executing the stored procedure using the Data View.
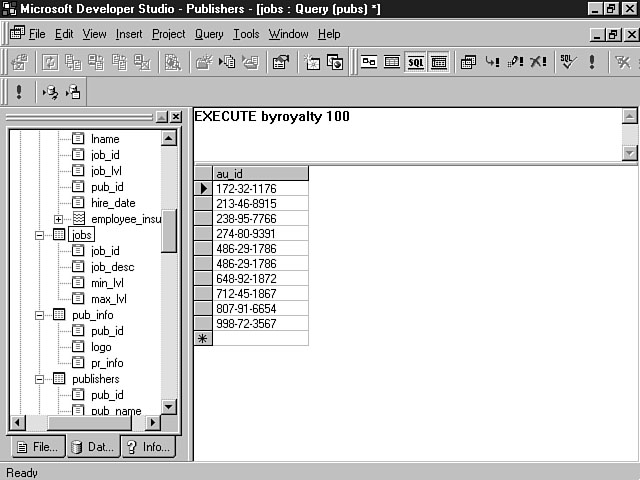
You also can use the SQL pane to call a stored procedure. The SQL pane enables
you to enter the SQL for stored procedures as well as to specify the parameters to
pass to the procedure. The proper syntax for calling a stored procedure is as follows: procedure name is the name of the procedure and parameter is the parameter to
pass to the procedure. After you have entered the stored procedure name and the required
parameters, click the Run button on the Query Designer toolbar to execute the stored
procedure.
The Query Designer verifies the syntax of your stored procedure call and displays
an error message if there's a problem with your syntax. The results are displayed
in the Results pane, as shown in Figure 9.30. Executing the stored procedure using the SQL pane. When you use the SQL pane to execute a stored procedure, neither the number of
rows returned nor the return value is displayed in the Results pane. Remember, the
Data View returns these values when you execute a stored procedure.
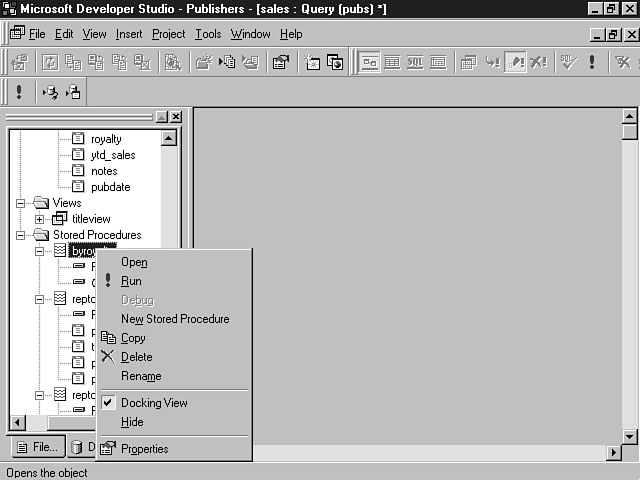
You can use the Data View to see the stored procedures and triggers for your database.
You may want to verify the SQL for the stored procedure before you execute it. To
open a stored procedure, select the procedure and click the right mouse button to
display the shortcut menu. Figure 9.31 displays the list of menu items for the Stored
Procedure shortcut menu. Opening the Stored Procedure shortcut menu. There are several options available from this shortcut menu. In the last section,
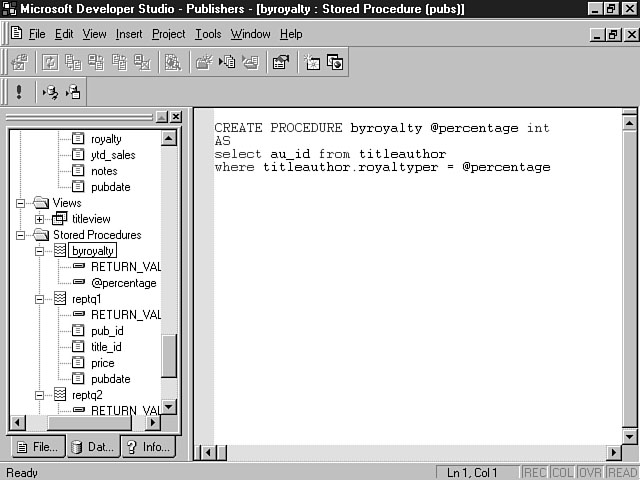
you learned how to execute a stored procedure by using the Run command. The Open
menu item enables you to open and view the SQL for a stored procedure. The procedure
is displayed in the Display pane to the right of the project workspace. Figure 9.32
shows the ByRoyalty stored procedure. Viewing the stored procedure. You will learn how to create and edit stored procedures in tomorrow's lesson.
You can use the Query Designer to manually add, change, and delete data. You discovered
in yesterChapter's lesson that the connection in your Visual InterDev project is a live
connection to the database. Changes that you make manually or through your queries
have an immediate impact on the information stored in the database. You can use the
Results pane to manually update the database. Your ability to make updates to the
database depends on your database permissions and any triggers that have been established
to enforce referential integrity for the database.
To add new data to a table, place your cursor in the first empty row in the Results
pane. This row is denoted with an * (asterisk) in the box to the left of the Column
field. When you begin to enter data for the row, the asterisk changes to a pencil
indicator, signifying that you are editing the row. After you have finished entering
the data for the last column, the Query Designer commits the information to the database.
Figure 9.33 depicts a row that is being added to the Authors table in the Pubs database. Using the Results pane to add data.
To change the information stored in a database, place your cursor in the field
you want to change and make the appropriate update. The change is confirmed when
you exit the field. You can press the ESC (Escape) key before you move the cursor
to cancel changes for a field. To cancel changes made to a row, press the ESC key
while the cursor is in a field that hasn't been changed. Eventually you may have to update a row that has already been updated by another
user. In these situations, the Query Definitions Differ dialog window will display,
indicating the conflict. You can choose to overwrite the other user's changes, cancel
your changes, or return to the Results pane and run the query again to view the other
person's changes.
You also can use the Results pane to delete rows within a database. Again, this
ability is based on the permissions that have been established in the database concerning
data deletion. To delete a row, select the entire row that you want to delete by
clicking the left mouse button on the box to the left of the Column field. Once the
row is highlighted, press the DEL (Delete) key. You also can select Delete from the
Edit menu to delete the row. For deletes, a warning message is displayed, enabling
you to confirm your delete.
The lesson for toChapter has provided a wealth of knowledge and instruction concerning
the Visual Data Tools. You have learned how to maximize your productivity by using
these robust database programming tools that are included with Visual InterDev. Database
programming is a big part of your application. You now can probably see the benefit
to having visual aids to help you through this process. First, you discovered how to use the Query Designer to generate your SQL statements.
You spent the majority of the Chapter learning how to work with the Query Designer workspace
and features to visually construct your queries. The lesson provided an in-depth
look at each of the Query Designer panes. You learned about the features of each
pane and how to use these features to your advantage. Along the way, the lesson provided
a guided tour through an example of how to use these features in a real-world situation.
You should now have a very good understanding of the four panes of the Query Designer
and feel comfortable in using these panes to build queries and interact with the
database. You also learned how to manipulate the SQL statements that are generated by the
Query Designer. For this part of the lesson, you used the SQL pane of the Query Designer
to build custom SQL statements. The next part of the lesson focused on how to use the Query Designer to interact
with stored procedures and triggers. During this section, you learned the different
methods of executing a stored procedure and how to pass parameters to a stored procedure.
The final lesson for the Chapter taught you how to enter and modify information in the
database, using the Results pane of the Query Designer. You should feel very confident about using the Visual Data Tools to interact with
the database. The Visual Data Tools can significantly boost your productivity and
provide a great tool for working with the database.
For toChapter's Workshop, I want you to apply the concepts you learned toChapter against
a real database. You may be using MS SQL Server as your database. If this is the
case, you can practice using some of the examples that were covered toChapter. If you
are using a different database, establish a connection with the database and practice
using the Query Designer features and panes to build some queries. Practice makes
perfect, and this Workshop should enable you to perfect your knowledge of the Visual
Data Tools.
|
|||||||||||||||||||||||||||||||||||||
|
|


Popular Tutorials
-
 MS Access
1109
MS Access
1109
-
 C++
1222
C++
1222
-
 HTML
584
HTML
584
-
 JavaScript
616
JavaScript
616
-
 Vbscript
873
Vbscript
873
-
 Oracle
473
Oracle
473
-
 VC++
875
VC++
875
-
 SQL
2959
SQL
2959
-
 XML
514
XML
514
-
 Java
814
Java
814
-
 Perl
455
Perl
455
-
 Linux
451
Linux
451


